
Fort Wayne Leads the Way in Beating the Heat |
City’s 2024 Heat Watch study shows where temperatures soar—and how trees, water, and smart planning can keep neighborhoods cooler. |
 |
🌡️ Fort Wayne Releases Heat & Air Quality Study ResultsNew Mapping Reveals Where Extreme Heat Hits Hardest
The City of Fort Wayne has released the results of its 2024 Heat Watch study, offering the most detailed look yet at how heat and air quality vary across neighborhoods. Conducted on August 26, 2024, the project was part of a national campaign organized by CAPA Strategies and the National Integrated Heat Health Information System (NIHHIS), with support from the NOAA Climate Program Office.
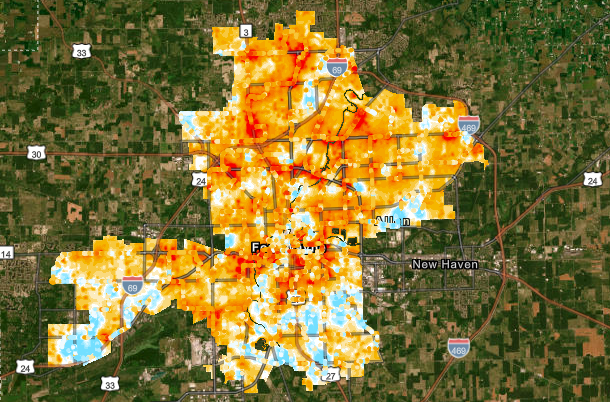
The study is significant because extreme heat is the deadliest natural hazard in the United States—and its effects are not evenly felt. Fort Wayne’s mapping confirms that location matters: neighborhoods with fewer trees, more concrete and asphalt, or historic underinvestment tend to trap and retain more heat. Conversely, areas with greenspace and water features experience cooler conditions.
More than 60 local volunteers drove pre-planned routes during three time periods—morning (6–7 a.m.), afternoon (3–4 p.m.), and evening (7–8 p.m.)—collecting nearly 80,000 measurements of temperature and humidity across a 100-square-mile area. This data was then analyzed using advanced modeling techniques and cross-validation to create high-resolution maps showing temperature and heat index distribution throughout the day. Key findings included:
City leaders plan to use these results to guide future climate resilience strategies, including tree planting initiatives, targeted cooling centers, and better urban planning. By linking heat data with social and economic conditions, officials hope to prioritize investments where residents face the highest risks from extreme heat.
This study is a critical step in building Fort Wayne’s Heat Action Plan, which will inform long-term strategies to protect residents, infrastructure, and public health in a warming climate.
❓ FAQ: How Was the Data Collected?
Q: Who collected the data?
Q: How were temperatures measured?
Q: How accurate are the sensors?
Q: How were citywide maps created?
Q: Why three time periods? |